September 2023
IN THIS ISSUE
Law of Large Numbers Tweet Warnings
“Short and Distort” vs. “Meme Stock Mania”
Pop Quiz: Charting
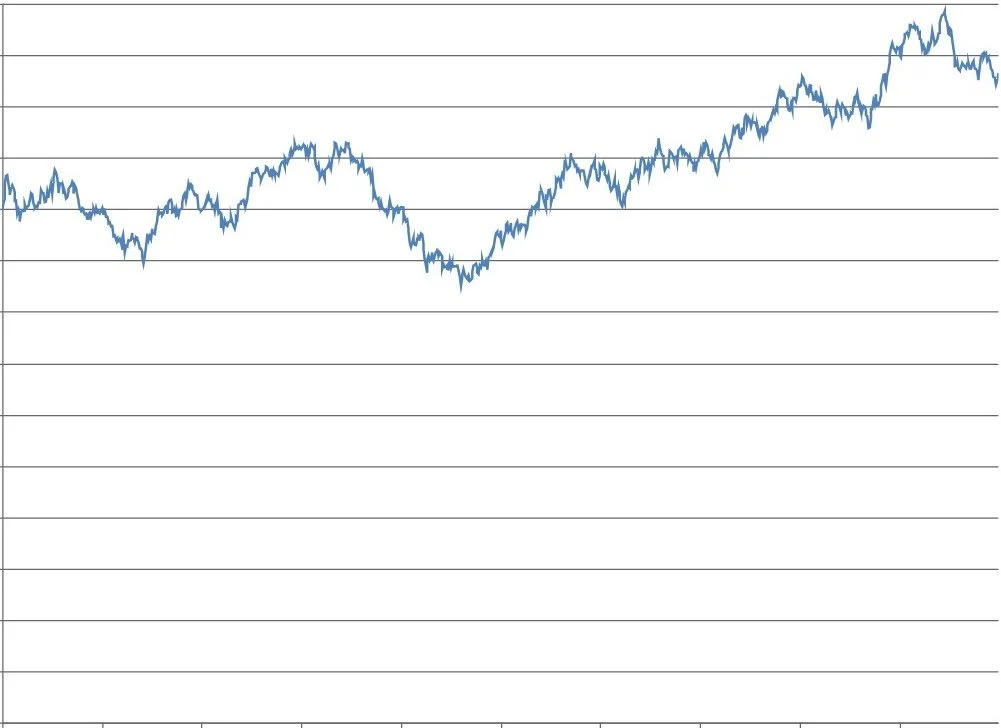
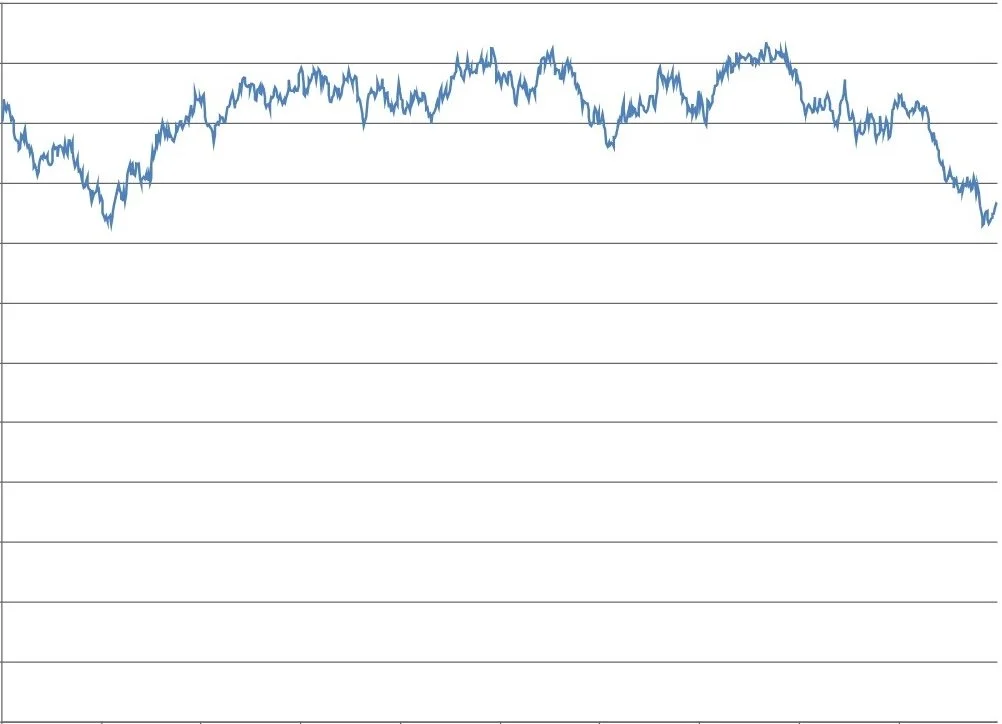
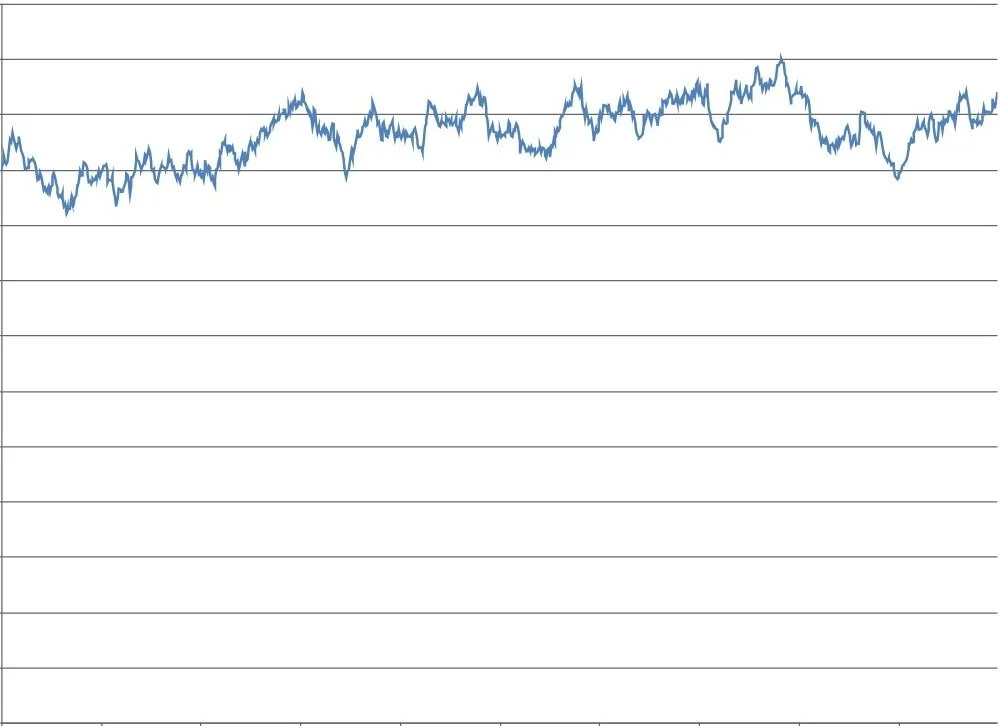
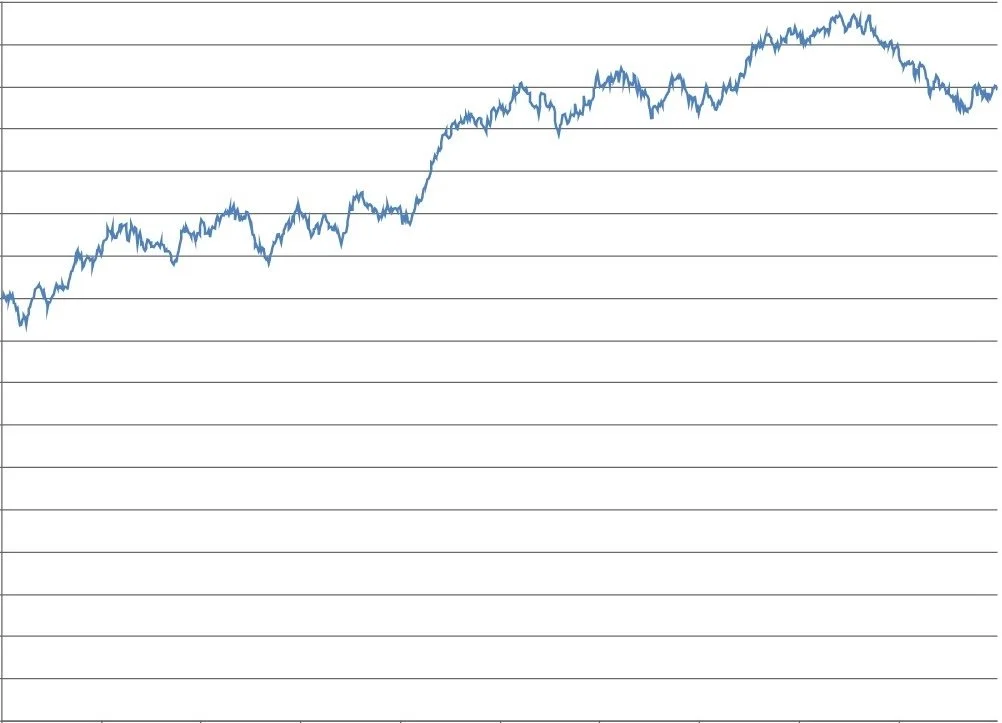
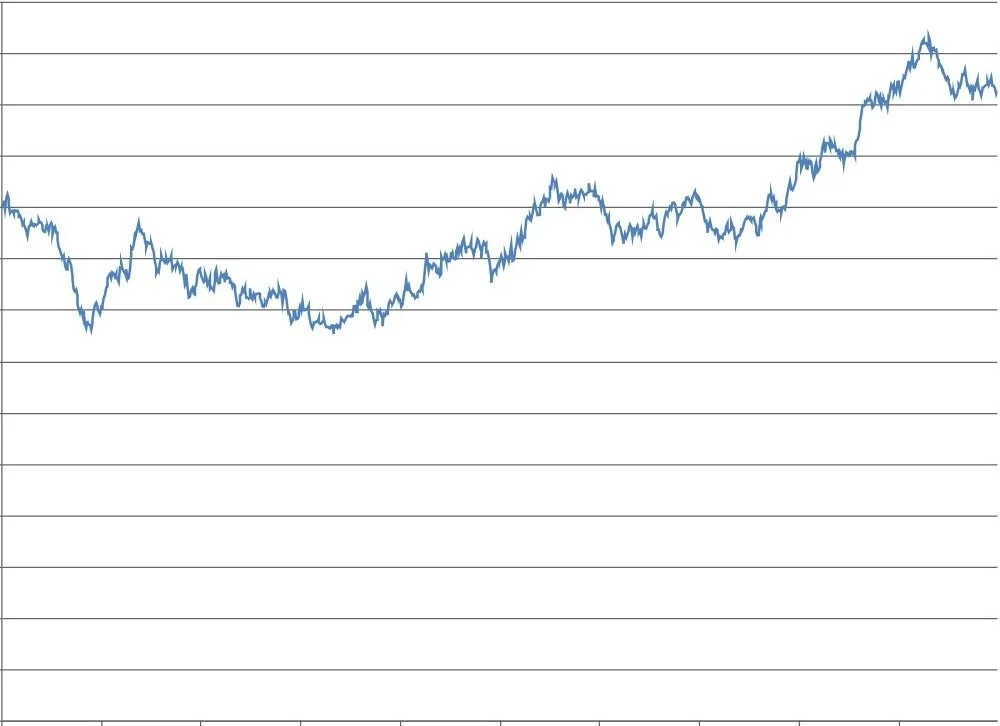
Pop quiz: Identify which of these price charts are real stocks and which are randomly generated:
Price chart 1
Price chart 2
Price chart 3
Price chart 4
Price chart 5
Price chart 6
In honor of evil teachers everywhere… all 6 were randomly generated. I used the Stock Price Pattern Generator at www.buyupside.com, which uses a “random walk with drift” recursive algorithm to generate prices. The input parameters for these charts are below(1).
In each of these charts you will find the popular technical patterns including head-and-shoulders, double bottoms, ascending triangles, cup-and-handles, and others. This presents a huge problem for technical analysts - price charts are often indistinguishable from randomness. Particularly when investing in highly efficient markets (an important prior), technical indicators usually lack predictive value for future price movements.
In a randomly generated chart, a head-and-shoulders top is no more likely to result in a move higher, lower, or sideways - because the chart generation process is random. Thinking in Likelyhoods, unless technical analysts can first argue convincingly that their charts are indeed distinguishable from randomness, none of their technical analysis that follows should be relied upon for investing decisions.
All this came to mind when I saw this piece by CNBC’s Nick Wells, The Dow missed its 14th straight gain — coin flip could have done that. Back in July the Dow Jones Industrial Average went on a 13 day winning streak, and market participants noticed that this streak was so rare that its longest rally on record was a 14 day winning streak in 1987.
Again, Thinking in Likelyhoods, informed investors should ask: “Could randomness alone produce such an unusual streak?” Indeed, randomness can explain this incidence very well.
Just as stock prices jiggle around every minute, so too do random coin flips. Imagine flipping a coin once per day, with Heads being a gain and Tails being a loss in the DJIA. Now do this for many years and see how often we get a 13 day winning streak. If a fairly-defined coin flipping process would produce similarly rare streaks of Heads, surely we should not be surprised by - and certainly we should not make momentum or trend-following trades - on the basis of a similar winning streak in the Dow.
Here’s Nick Wells:
CNBC ran a simulated coin flip thousands of times and counted the number of times “heads” came up in a row. Treat those like daily gains in the stock market. Remember, these are totally independent events where the outcome is not affected by the prior simulation.
Since the Dow’s inception in 1897, there have been nearly 33,000 trading days. In that time, we’ve seen a single 14-day streak of gains and two streaks that ended at 13 positive sessions in a row. Prior to this week, the last 13-day rally was in January 1987.
In our simulation of flipping a fair coin 33,000 times and recording the number and length of “heads” streaks, we actually got exactly the same as the real Dow: a single 14-day rally. With a coin slightly biased toward “heads” (in this case, giving the results of each flip a 0.523 chance of being heads), our simulation turned up two rallies of 14 days and three streaks that ended at 13 days.
In the world of stock market speculation, pundits like to attribute explanations for every twist and turn. But just by using the 50-50 assumption of our theoretical coin, we can show that long streaks are not as extraordinary as they may seem.
Managers are incentivized to make overly confident prognostications with every headline, which means it is up to investors to distinguish Signal from Noise, Skill from Luck, and Significance from Randomness.
For your reading pleasure, here is my mandatory reading list on randomness in markets and beyond:
Burton Malkiel’s A Random Walk Down Wall Street: The Best Investment Guide That Money Can Buy
Nassim Taleb’s Fooled by Randomness: The Hidden Role of Chance in Life and in the Markets
Michael Mauboussin’s The Success Equation: Untangling Skill and Luck in Business, Sports, and Investing
Nate Silver’s The Signal and the Noise: Why So Many Predictions Fail - But Some Don’t
James Owen Weatherall’s The Physics of Wall Street: A Brief History of Predicting the Unpredictable
Leonard Mlodinow’s The Drunkard’s Walk: How Randomness Rules Our Lives
John Allen Paulos’s Innumeracy: Mathematical Illiteracy and Its Consequences
(1) The inputs used for these charts were:
Mean of Random Component = 0
Standard Deviation of Random Component = 1
Trend = 0
First Stock Price = $100
Number Prices = 1000
Random Number Seed = integers 1 through 6
ONE MORE THING…
Law of Large Numbers Tweet Warnings. Investors would have made more money buying the S&P 500 instead of following 'Big Short' investor Michael Burry's tweet warnings, an expert says
“Short and Distort” vs. “Meme Stock Mania”. Dan Loeb, like Bill Ackman, was burned by shorting and is now capitulating. Markets are balancing machines, and this is the game you play when stock picking short. Dan Loeb Surrendered But Meme Army Still Hits Bears for Millions
The information and opinions contained in this newsletter are for background and informational/educational purposes only. The information herein is not personalized investment advice nor an investment recommendation on the part of Likely Capital Management, LLC (“Likely Capital”). No portion of the commentary included herein is to be construed as an offer or a solicitation to effect any transaction in securities. No representation, warranty, or undertaking, express or implied, is given as to the accuracy or completeness of the information or opinions contained herein, and no liability is accepted as to the accuracy or completeness of any such information or opinions.
Past performance is not indicative of future performance. There can be no assurance that any investment described herein will replicate its past performance or achieve its current objectives.
Copyright in this newsletter is owned by Likely Capital unless otherwise indicated. The unauthorized use of any material herein may violate numerous statutes, regulations and laws, including, but not limited to, copyright or trademark laws.
Any third-party web sites (“Linked Sites”) or services linked to by this newsletter are not under our control, and therefore we take no responsibility for the Linked Site’s content. The inclusion of any Linked Site does not imply endorsement by Likely Capital of the Linked Site. Use of any such Linked Site is at the user’s own risk.


