July 2021
If you can’t beat ‘em, join ‘em
Reality sets in for AMC
The prescient Jack Bogle
Conflicting advice on inflation
Just last month I wrote two separate segments titled “Inflation Inflation Inflation” and “Conflicting Advice”. This month the news found a way to marry the two: Folks are giving all kinds of conflicting advice about the best inflation hedge.
Here’s Jim Cramer, Investors buy tech stocks to hedge inflation, Fed rate hike, Jim Cramer says:
“If you want one industry that’s immune to both inflation and a Fed-induced slowdown, well it’s big-cap tech,” the “Mad Money” host said after the market closed.
“Hyper-growth tech stocks are actually what works best during a slowdown.”
…
“I don’t think [Fed Chair Jerome] Powell’s going to change his stance, but there are a lot of money managers who disagree,” he said. “When we see an [inflation] number like this, they sell a lot of other things and they buy tech.”
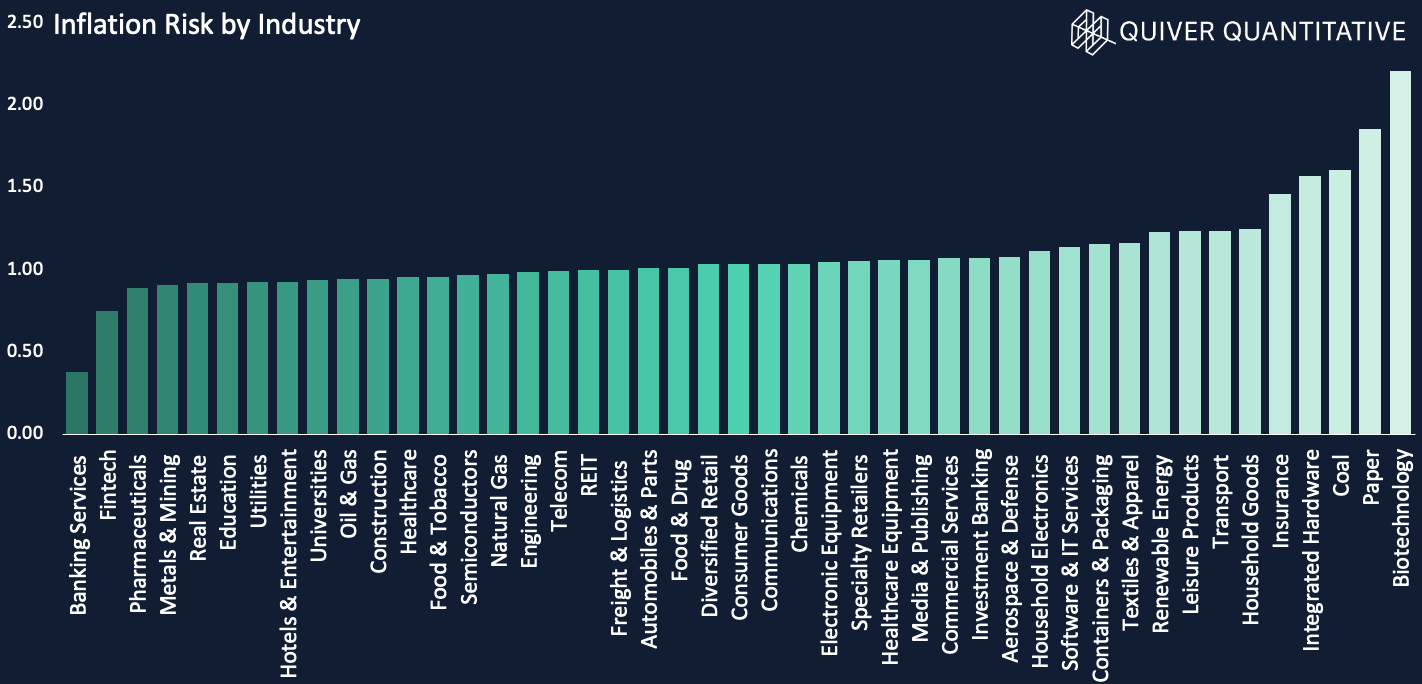
Now here’s data from Quiver Quantitative‘s analysis on inflation:
“we decided to create a tool for better understanding the impact of inflation changes on different companies. We built a multi-layered Inflation Model that outputs an ‘Inflation Risk’ score to public U.S. equities. This score is intended to estimate how much each stock has been positively or negatively affected by changes in inflation expectations.”
“Reviewing the graph [below], we see that real-estate, and commodity-based industries are expected to perform better during inflationary periods, whereas technology and growth industries have more risk exposure.”
Source: Quiver Quantitative, https://www.quiverquant.com/blog/071421
Which answer will you choose as the better inflation hedge: A) Hyper-growth tech stocks, or B) Real estate?
I say: C) Quit stock picking already.
Got junk?
No, not in your spare bedroom, I mean junk bonds:
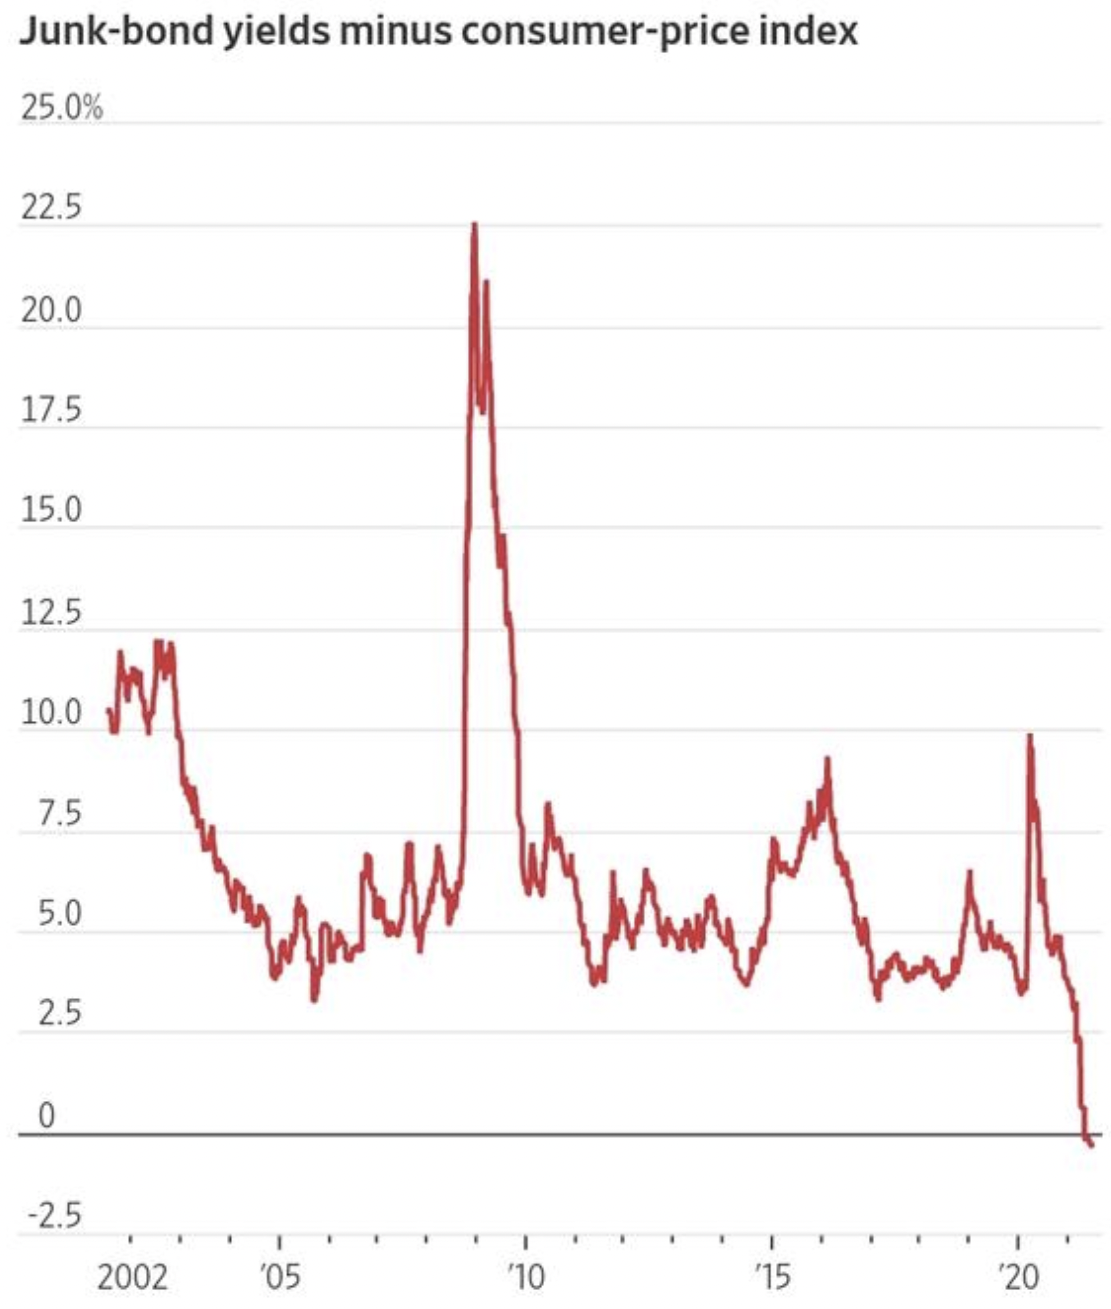
A rally in corporate debt rated below investment grade has pushed yields to record lows around 4.57%, according to ICE Bank of America data through Thursday, while consumer prices rose 5% in May compared with a year earlier. That marks the first time on record junk-bond yields have dropped below the rate of inflation, according to Bespoke Investment Group.
The move upends the conventional logic of investing in bonds, which are typically prized for protecting investors’ money. Junk-rated companies include those most likely to miss interest payments or go bankrupt. Buying bonds that yield less than inflation means locking in a loss.
That’s from the Wall Street Journal’s Junk-Bond Rally Pulls Yields Below Inflation. In fact, dating back to 2002, the CPI has never been within 2.5% of the junk-bond yield.
Source: Bespoke Investment Group,
Wall Street Journal, https://www.wsj.com/articles/junk-bond-rally-pulls-yields-below-inflation-11625817833
Which brings us back to the question, is this a permanent structural change or a transitory change? That chart seems pretty supportive of the transitory case, but what do I know.
Loss Aversion is Costly
Last month I cited Wim Antoon’s 2016 paper titled Market Timing: Opportunities and Risks. Wim notes that the largest daily gains are clustered near the largest daily downturns, and included this revealing statistic:
Consider the time-frame of 1961–2015, or 55 years. The buy and hold annual return was 9.87%.
Yet, if you missed the 81 most positive days during this 55 year period …your return plummets to a meager .03% annualized (!).
This month, The Motley Fool wrote a piece Trying to Time the Stock Market Is a Bad Idea - Here’s Why that included variations on this statistic:
There are numerous studies showing the same pattern across different time periods -- the S&P 500's growth can be entirely attributed to a small number of days.
One paper found that over a 20-year span, the 35 best days accounted for all of the gains in that period. That's less than 1% of the more than 5,000 trading days across two decades. Even more frustrating, many of the market's best days occur within a week of the worst days. That's trouble.
…
Bank of America published a paper recently that quantified the effects of missing the 10 best and worst trading days for each decade, based on S&P 500 daily returns. The authors found that someone who had invested in the S&P 500 from 1930 through 2020 would have achieved nearly an 18,000% return. If someone happened to miss the 10 best days of each decade, that number drops to 28%.
Here’s another from CNBC:
For example, if you missed the best 20 days in the S&P 500 over the last 20 years, your average annual return would shrink to 0.1% from the 6% you’d have earned if you’d stayed the course.
Loss aversion that induces selling prior to the best days of returns is a direct cause of underperformance. Selling during selloffs “works” to reduce portfolio volatility. But rather than “volatility management”, the more authentic “Risk of Ruin management” attends to the risk of permanent loss of capital while standing ready to capture the loss aversion premium paid by others.
Warren Buffett’s “Mistake”
Here is the understatement of the century: Warren Buffett knows what he’s doing. Well, let me a little more precise: Warren Buffett has a proven investment process. It is interesting to read some analysts who note - and sometimes take pride in - the fact that Berkshire Hathaway sold out of its airlines positions very near the 2020 bottom and of course missed out on the subsequent recovery.
Did Buffett make a mistake by selling airlines? If your answer to that question involves using the subsequent price action to evaluate the quality of the decision, you are engaging in Resulting. There are countless obvious examples of what I call “Resulting fails”:
Drunk driving. If you make it home safely, the decision to drive drunk was okay!
Blackjack. If you hit on 20 and get an Ace, you made the right decision!
If you pick up a penny in front of a steamroller and get out of the way in time, you found a good strategy.
Day trading. Well, this one writes itself.
All of these share the common theme of “working” in the short term but failing in the long term. Good decisions can have negative outcomes, and poor decisions can have positive outcomes. A strategy that “works once” could very well have a negative expected value! But when the Likelyhoods are not in your favor, the law of large numbers will eventually catch up to you and expose the flaws in your strategy. It takes long-term metrics, not short-term individual case studies, to reveal a strong decision making process, and Buffett certainly has the long-term metrics to show for his proven process.
Annie Duke calls this “Thinking in Bets”. I call this “Thinking in Likelyhoods”.
ONE MORE THING…
If you can’t beat ‘em, join ‘em: Passive indexing with ETFs is so popular, now stock pickers are storming the ETF world: Cathie Wood Is Just a Start as Stock Pickers Storm the ETF World
Reality sets in for AMC: AMC share price cut in half as reality sets in for meme stock investors
The prescient Jack Bogle offered timeless advice for investing during times of elevated prices and volatility, just like today’s markets. Spoiler alert… market timing will not work. Jack Bogle: Sell Your Index Funds At All-Time Highs?
The information and opinions contained in this newsletter are for background and informational/educational purposes only. The information herein is not personalized investment advice nor an investment recommendation on the part of Likely Capital Management, LLC (“Likely Capital”). No portion of the commentary included herein is to be construed as an offer or a solicitation to effect any transaction in securities. No representation, warranty, or undertaking, express or implied, is given as to the accuracy or completeness of the information or opinions contained herein, and no liability is accepted as to the accuracy or completeness of any such information or opinions.
Past performance is not indicative of future performance. There can be no assurance that any investment described herein will replicate its past performance or achieve its current objectives.
Copyright in this newsletter is owned by Likely Capital unless otherwise indicated. The unauthorized use of any material herein may violate numerous statutes, regulations and laws, including, but not limited to, copyright or trademark laws.
Any third-party web sites (“Linked Sites”) or services linked to by this newsletter are not under our control, and therefore we take no responsibility for the Linked Site’s content. The inclusion of any Linked Site does not imply endorsement by Likely Capital of the Linked Site. Use of any such Linked Site is at the user’s own risk.


